GSoC Interview: Akshat Bhargava on new data visualisations for BlueGenes

This is our blog series interviewing our 2019 Google Summer of Code students, who will be working remotely for InterMine for 3 months on a variety of projects. We’ve interviewed Akshat Bhargava, who will be creating data visualisations for BlueGenes.

Hi Akshat! We’re really excited to have you on board as part of the team this summer. Can you introduce yourself?

akshat1Hi InterMine team, I’m very excited too for this upcoming summer! I’m a Computer Science undergraduate going to start my 3rd year this August. I’m primarily a Javascript Developer (Web & Hybrid Mobile) and have been working with it for the last 2.5+ years, but the real me is a person who loves to solve problems in general, may they be related to programming or not. I’ve been exploring the field of data visualization for the last few months and I am in love with it. Have a look at IPL (cricket) data viz I created a few months back here.

Apart from coding, I love reading about psychology, history and watching horror movies.

What interested you about GSoC with InterMine?

I feel it magical how numbers show their true faces when seen via a meaningful visualization, and this is why I’m most excited for this summer with InterMine.

Real World Bio Data + Data Viz = Something big coming in! ❤

Another reason for my interest in InterMine, is that I applied to InterMine last year too for Cross InterMine Search Tool and couldn’t make it, but understood it’s community and how they work. The mentors are very helpful and supportive to everyone, so I directly jumped here this year. 😀

Tell us about the project you’re planning to do for InterMine this summer.

InterMine has tons of different types of biological data, this summer I’ll mostly be working on discussing and developing visualizations for data, making it easier to biologists to understand it in a easier way, and draw relevant conclusions with a single sight to the graphs.

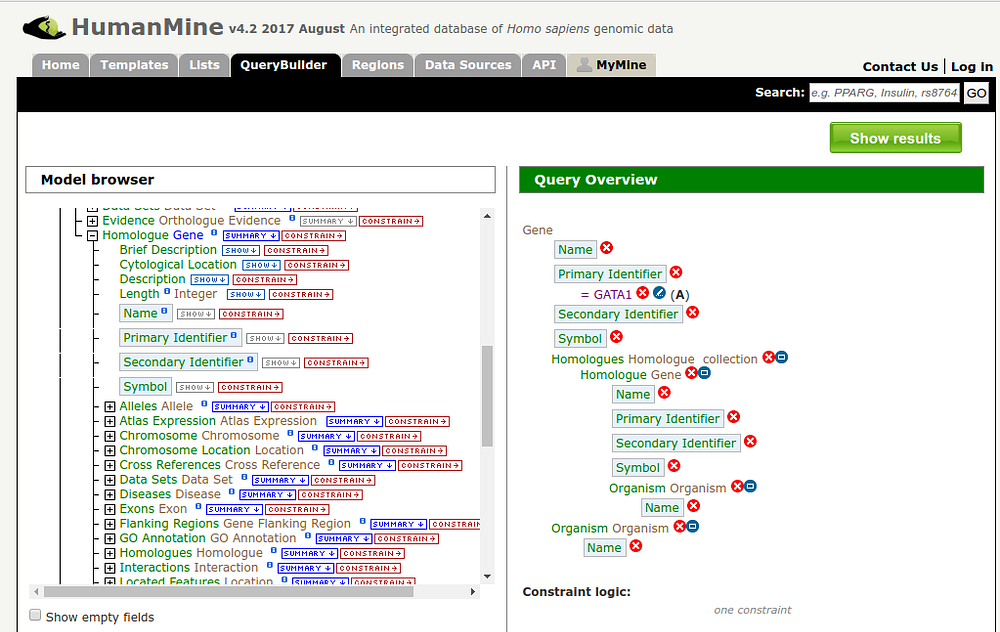
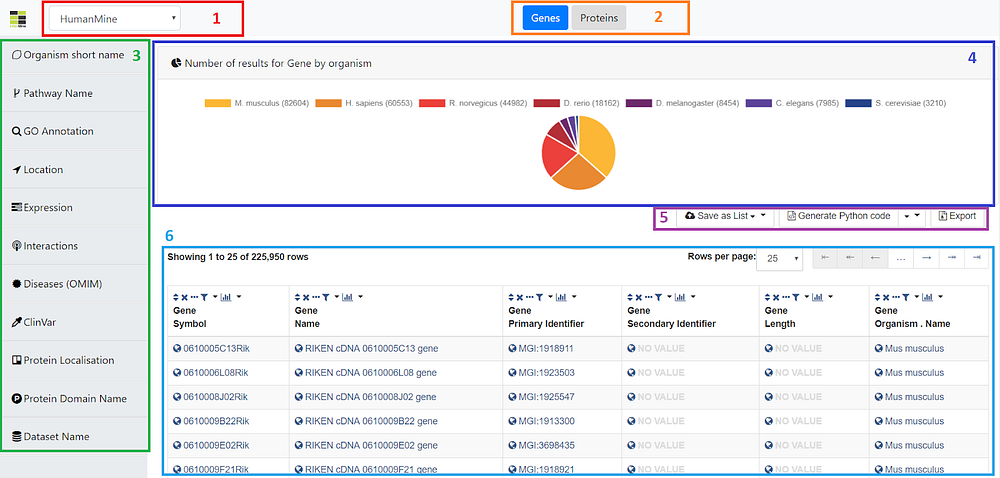
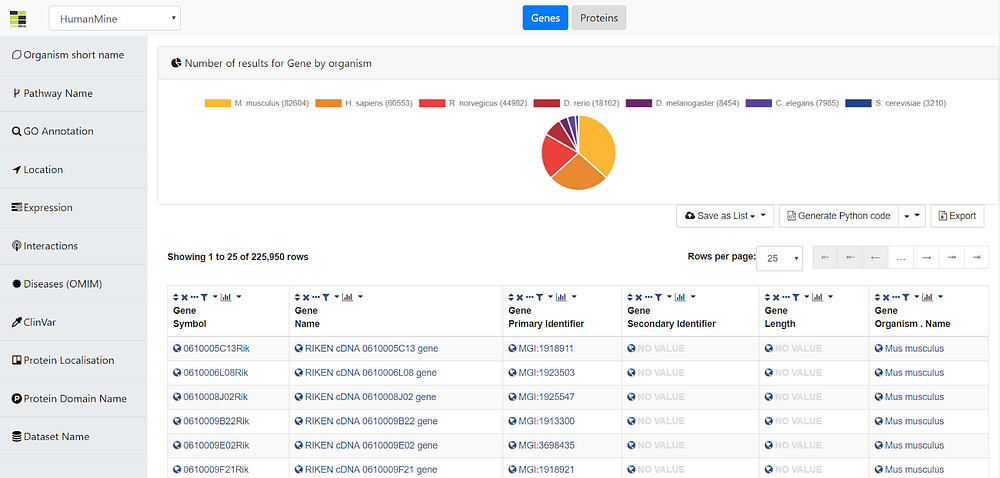
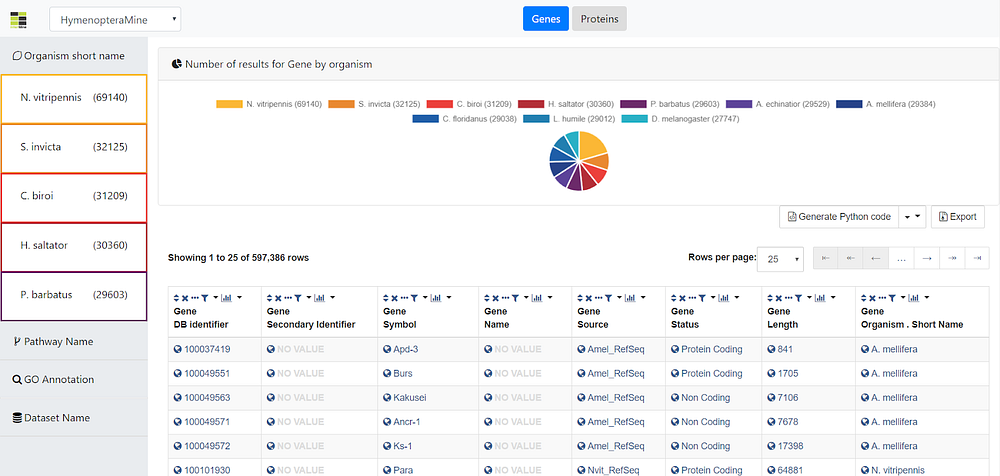
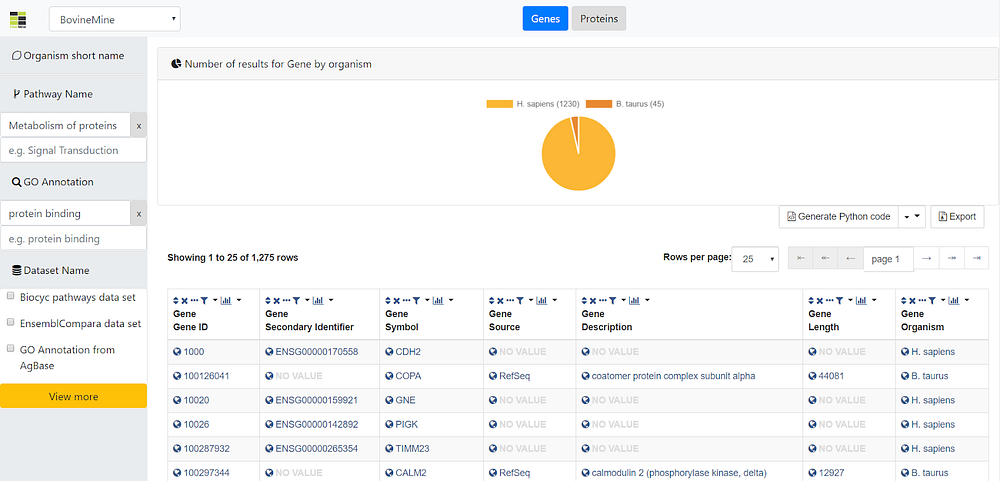
There is a software called BlueGenes, which is already developed and helps explore different mines, it provides a tool API which allows Javascript developers to create additional visualization tools on top of it, which can be integrated on any Gene or Protein result page. My goal for this summer is to create a different variety of such visualization tools in order to enrich the visualization of different types of data.

As an example of how useful is what I’m doing, one of the visualizations I’ll be developing will help us understand how the expression of a particular gene is distributed among different tissues. This information is helpful for cancer biologists that want to assess if a gene is highly expressed across different tissues of an organism, because that gives a relative picture on to what degree it’s implicated in diseases.

Are there any challenges you anticipate for your project? How do you plan to overcome them?

Data visualization is something that requires you to understand the data properly first in order to be able to actually create some meaningful visualization out of it, and since I’m not very familiar with InterMine’s data model and the related biological terms, I’ll face some difficulties during my thought process of “what and why” to visualize. To overcome this, I’m already exploring more and more of the InterMine’s data model, trying to understand how to deal with different types of data, and how to create the appropriate visualization for them. Mentors are really helping me out with this (overall in terms of tech, viz and everything). 🙂

Share a meme or gif that represents your project

akshatmeme1

Data integration and Machine Learning for drug target validation

Hi!

In this blog post I would like to give a brief overview of what I’m currently working on.

Knowledge Transfer Partnership: what & why?

First, in order to give context to this post, last year InterMine at University of Cambridge and STORM Therapeutics, a spin-out of University of Cambridge working on small modulating RNA enzymes for the treatment of cancer, were awarded a Knowledge Transfer Partnership (KTP) from the UK Government (read this post for more information). With this award, the objective is to help STORM Therapeutics advance their efforts in cancer research, and contribute to their ultimate goal of drug target validation.

As part of the KTP Award, a KTP Associate needs to be appointed by both the knowledge base (University of Cambridge) and the company (STORM). The role of the KTP Associate is to act as the KTP Project Manager and is in charge of the successful delivery of the project. For this project, I was appointed as the KTP Associate, with a Research Software Engineer / Research Associate role at the University of Cambridge, for the total duration of the project: 3 years.

Machine learning and a new mine: StormMine

Now that you know what the KTP project is about, and who is delivering it, let’s move on to more interesting matters. In order to successfully delivering this project, the idea is to use the InterMine data warehouse to build a knowledge base for the company, STORM, that enables their scientist to have all the relevant data for their research in a single, integrated, place. For this reason, several new data sources will be integrated into a STORM’s deployment of the InterMine data warehouse (StormMine, from now on), and appropiate data visualizations will be added.

Then, once the data is integrated, we can think towards analysing the data to gather insights that may help the company goals, such as applying statistical and Machine Learning methods to gather information from the data, as well as building computational intelligence models. This leads the way towards what I’ve been working on since my start in February, and will continue until July 2019.

In general terms, I’m currently focused on building Machine Learning models that are able to learn how to differentiate between known drug targets and non-targets from available biological data. This part of work is going to be used as my Master’s Thesis, which I hopefully will deliver in July! Moreover, with this analysis, we will be able to answer three extremely relevant questions for STORM, and which are the questions leading the current work on the project. These questions are

  1. Which are the most promising target genes for a cancer type?
  2. Which features are most informative in predicting novel targets?
  3. Given a gene, for which cancer types is it most relevant?

If you are interested in learning more about this work, stay tuned for next posts, and don’t hesitate contacting me, either by email (ar989@cam.ac.uk) or connect with me in LinkedIn (click here)!


Google Summer of Code 2018 - Wrapping up the final results for the Data Browser


The GSoC 2018 is coming to its end, and after 3 months of hard work, I can proudly present a summary of all our achievements during this summer of code.


Summary of Project Goals

InterMine is a open source Data Warehouse intended to be used for the integration and analysis of complex biological data. With InterMine, you can explore organism and other research data provided by different organizations, moving between databases using criteria such as homology.

The existing query builder in InterMine requires some experience to obtain the desired data in a mine, which can become overwhelming for new users. For instance, for a user interested on searching data in HumanMine using its query builder, he or she would need to browse through the different classes and attributes, choosing between the available fields and adding the different constraints over each of them, in order to get the desired output.

For example, a simple query you might want to glean from InterMine might be as follows:

Query: Given the human gene symbol “GATA1”, show all homologous genes in other organisms. (More on Homologues, also spelled homologs: https://en.wikipedia.org/wiki/Homology_(biology)

Problem: This query sounds simple-ish, but building it in our query builder requires a strong familiarity with the data model, and can be confusing for anyone new to InterMine. We would like the data browser to be more complex than the simplicity of a simple keyword search, but less complex than the current query builder. For context, here’s the humanmine query builder: http://www.humanmine.org/humanmine/customQuery.do. We have attached a screenshot of what it looks like for the homology query mentioned above, where it can be seen why it looks a little intimidating.

This requires the user to have a decent knowledge of the model schema in order to successfully build a correct query for the expected query results. For new users this workflow can become, indeed, overwhelming to search for specific information in the data.

For this reason the goal of this project is to implement a faceted search tool to display the data from InterMine database, allowing the users to search easily within the different mines available around InterMine, without the requirement of having an extensive knowledge of the data model.


Summary of Project Achievements

In order to maintain a good workflow, the project was divided into three major versions or milestones, coinciding the deadline of each one with GSoC evaluation phases. The main developments in each milestone are listed below, and comprises a total of 67 closed issues with 194 commits.

Milestone 1 (June 11). In the first milestone (related GitHub issue here), the following features were added:

  1. Initial environment setup (#1)
  2. Server routes to query for ‘counts’ of data (#2)
  3. Use InterMine im-tables for dynamically loading the data on the views (#3)
  4. Unit testing for the server-side routes (#4)
  5. Functional general statistics of the data with graphics and plots (#6)
  6. Searching data on HumanMine (basic ontology concepts) + Unit testing (#8, #9)
  7. Further User Interface improvements (#22, #23, #24, #25, #26, #27, #28)
  8. Code documentation and optimization (#7)

Milestone 2 (July 9). In the second milestone (related GitHub issue here), the following features were added:

  1. Query builder with automatically filled selectable fields + Unit testing (#11)
  2. Filtering options when searching for data + Unit testing (#13)
  3. Improvements to adapt to small devices (#29)
  4. Handling SSL errors (#30, #31)
  5. User interface improvements (#32, #34, #35, #36, #38)
  6. Show counts beside typeahead filters (#39)
  7. Allow users to add and remove filters (only one) (#40)
  8. Making the Dataset filter to be multiple checkbox (#42)
  9. Adding formal documentation using documentation.js (#43)
  10. Interactions filter (#44)
  11. Chromosome Locations filter
  12. Code documentation and optimization

Milestone 3 (August 6). In the third milestone (related GitHub issue here), the following features were added:

  1. Finish main dashboard interface (#5)
  2. Use InterMine color palette (#10)
  3. Enable save as list functionality (#16, #15)
  4. Add a ‘switch’ functionality to change between mines (#21)
  5. Option to show multiple filters for the same filter type at once (#41)
  6. ClinVar filter (#52)
  7. OMIM Disease filter (#53)
  8. Expression: Illumina bodymap filter (#55)
  9. Protein localisation: Protein Atlas filter (#56)
  10. JSON config file for mines to handle extra filters (#57)
  11. Show only default filters for mines not defined in JSON config and available in the registry (#58)
  12. Add running instructions (#61)
  13. Deep link to specific mine (#62)
  14. Remember which mine you were looking at last time (#63)
  15. User interface improvements (#66, #68)
  16. Handle an InterMine being down (#67)


Brief Overview of the Final Product

In the following figure, the different elements available on the browser interface are displayed and further explained.

As depicted above, the user is able to change between the different mines available in the InterMine registry by using the dropdown box in (1). Next, in (2) the viewed class can be changed, and currently it can be either Genes or Proteins. Moreover, in (3), the different filters available in the currently explored mine are displayed, where the user can filter the data shown in the table at (6) that better fulfills his/her requirements. Furthermore, some plots regarding to the data in the table are displayed on (4). Currently it shows a pie chart of individuals per different organism, but it will be extended with more plots in the future. Finally, the user has the option to save the table as list, generate the code to embed it elsewhere, or to export the results by using the options in (5).


More Screenshots of the Final Product


Related Blog Posts (in chronological order)


Links to Final Tool Code and Deployments


Future Work and Plans

There are already some features to be added to the browser after GSoC, some of them are, for instance, to allow users to add their personal InterMine’s API tokens for each mine and use them for the Save as List functionality of the table (link). Another useful feature that I wasn’t able to implement due to a temporary disabling in the InterMine ontology was a Phenotypes filter (link). Next, a new histogram plot to the top section about Gene length will be added (link). Furthermore, a “current class” filter will be added to the sidebar (link). Finally, another desirable feature would be to refactor the per-mine filters to use path query (link).


As a conclusion, the fact that the final product has been tested and is going to be truly helpful for the target community of users, is enough for me to be proud of the developed tool during this Google Summer of Code. Also the results of this project will allow us to, hopefully, publish a paper describing the new InterMine browser.